Implementing Time-Series Forecasting Model in Retail Sales
The term forecasting refers prediction made in advance. Every prediction is based on different variables that impact the overall sales cycle.
Advantages of forecasting in Sales are:
- Make informed decisions
- Identifying potential risks and opportunities
- Optimize business operations
- Improving and personalizing the user experience using sales patterns
This analytical approach necessitates the identification and comprehension of patterns within the time series data. By recognizing and understanding these patterns, businesses can gain valuable insights that enable them to make informed forecasts and projections about future trends and events.
Some of the examples of using time series forecasting models are predicting sales in retail, predicting energy demand in the utility sector, or prescription behavior of healthcare providers in pharmaceuticals. Here we are trying to explain the process of creating a forecasting model from time series data in a simpler to understand methods.
Lets delve deeper into creating a forecasting model using this data.
Information of the Dataset:
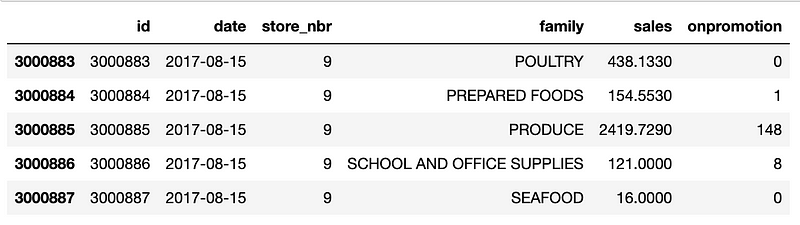
The data used in this case study, contains daily sales from different stores between 1-Jan-2013 to 15-Aug-2017. It contains sales data of 33 different product categories at 54 different stores. There are 3 Million records with 6 columns:
- 'id' : This is the unique identifier of the record
- 'date' : This field gives information about sales on a given day
- 'store_nbr' : This is a unique identified of the store with which sales data is associated
- 'family' : This is the product category
- 'sales' : This is the sales data of each store by product category
- 'onpromotion' : This field gives a number of items on promotion on that particular day.
train = pd.read_csv("train.csv", parse_dates=['date'])
train.tail()
Data Pre-processing :
To show a more manageable case study, we will limit the analysis to predicting monthly sales instead of predicting daily sales.
This helps us keep the analysis simpler for our audience and also avoid the results from overfitting. We will predict the monthly sales across all the stores for the given company.
df = extract_datetime_features(train)
df = df.groupby(['year','month']).sales.sum().reset_index()
df[:12]

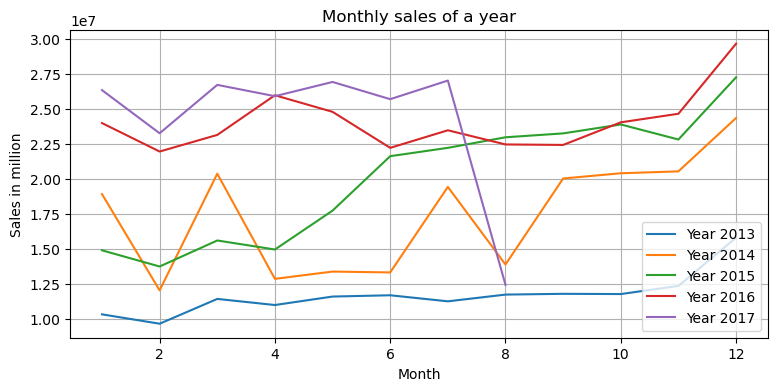
As we perform the Exploratory Data Analysis (EDA), we plot monthly sales data for given years. The plot shows a fluctuating trend of sales over the months and across the given years. We observed that we are missing data for 15 days in Aug 2017.
unique_years = df['year'].unique()
for year in unique_years:
plt.plot(df[df['year'] == year]['month'], df[df['year'] == year]['sales'], label=f'Year {year}')
plt.xlabel('Month')
plt.ylabel('Sales in million')
plt.title('Monthly sales of a year')
plt.legend()
plt.grid()
We also find various statistics of the data like min, max and mean values to find out the data distribution.
df.describe()
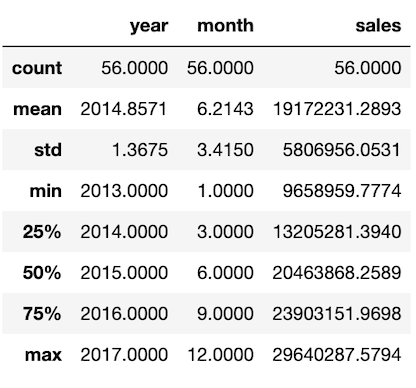
The action item derived from above EDA would be to remove the data for August 2017. Thereby we limit the data from Jan 2013 to Jul 2017.
Let's split the data into training and testing set. The training set of data will be used to train the model and is referred to as the training dataset, and the testing set is used to get predictions and test the model after the training process is executed and the model is created. This is known as testing dataset .
In addition to that changing column names for prophet model, as the prophet model only takes column names 'ds' for datetime data and 'y' for forecast values. From test dataset taking out sales value to validate model predictions on test dataset.
Model Fitting:
For keeping the process simpler we will fit a pre-trained model on the training dataset. Basically we are fine tuning a pre-existing model based on the training data.
Pre-trained models help us implement machine learning concepts by utilizing generic models created by 3rd party. We will utilize Prophet, by Facebook. Prophet is a procedure for forecasting time series data based on an additive model where non-linear trends are fit with yearly, weekly, and daily seasonality, plus holiday effects. It works best with time series that have strong seasonal effects and several seasons of historical data.
After splitting data into train and test datasets, we will fit the Prophet model on the given training dataset.
model = Prophet(yearly_seasonality=True)
model.fit(train_p)
Predicting sales for test data:
Once the model fit is done, the model is fine tuned as per the training data. This model will now be tested by predicting the sales values. We have the test components of the data split. We will compare the predicted value against the actual sales value and identify the accuracy of the predicted values. In real world scenario we will also have validation dataset in the data split. A validation dataset is a sample of data held back from training your model that is used to give an estimate of model skill while tuning model's hyperparameters.
pred = model.predict(test_X)
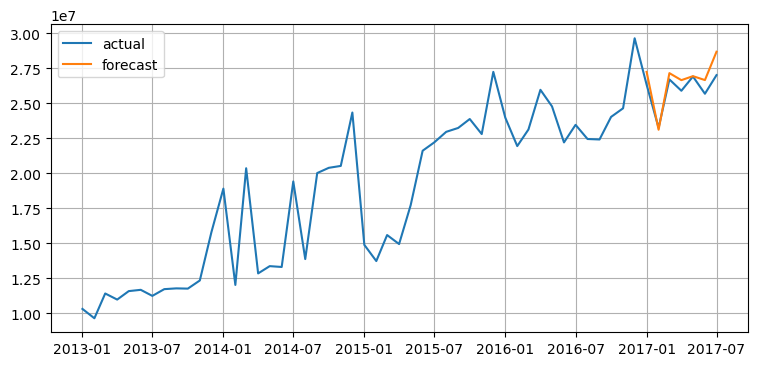
Visualizing Model's predictions on testing data by comparing prediction sales values and corresponding actual sales values. As shown in the plot, prediction sales for test data are predicted very close to the actual sales values which gives how precisely the model has learned from train data.
plt.plot(df.Month,df['sales'],label='actual')
plt.plot(pred.ds,pred['yhat'],label='forecast')
plt.legend()
plt.grid()
Conclusion:
This completes out the forecasting process, where how machine learning contribute to forecast using historical data.
It helps to get valuable insights, make informed future predictions, and gain a deeper understanding of the complex patterns hidden under data. By utilizing and recognizing the components, visualizing the data, choosing appropriate modelling techniques, and rigorously evaluating the results, can make accurate forecasts and drive meaningful decision-making in various domains. Whether it's financial markets, weather forecasting, or resource planning, the ability to interpret and analyze time series data is a powerful skill that helps organizations to pave the way for greater understanding and improved decision-making.
#arocom #artificialintelligence #machinelearning #datascience #ecommerce #timeseries #forecasting
Ask about our work
Author

Nidhi Dangar
Nidhi is machine learning enthusiast with a keen interest in leveraging data-driven solutions to tackle complex problems. She is dedicated to creating impactful and scalable solutions using Machine Learning and Artificial Intelligence that bridge the gap between theory and real-world applications. Follow her on: